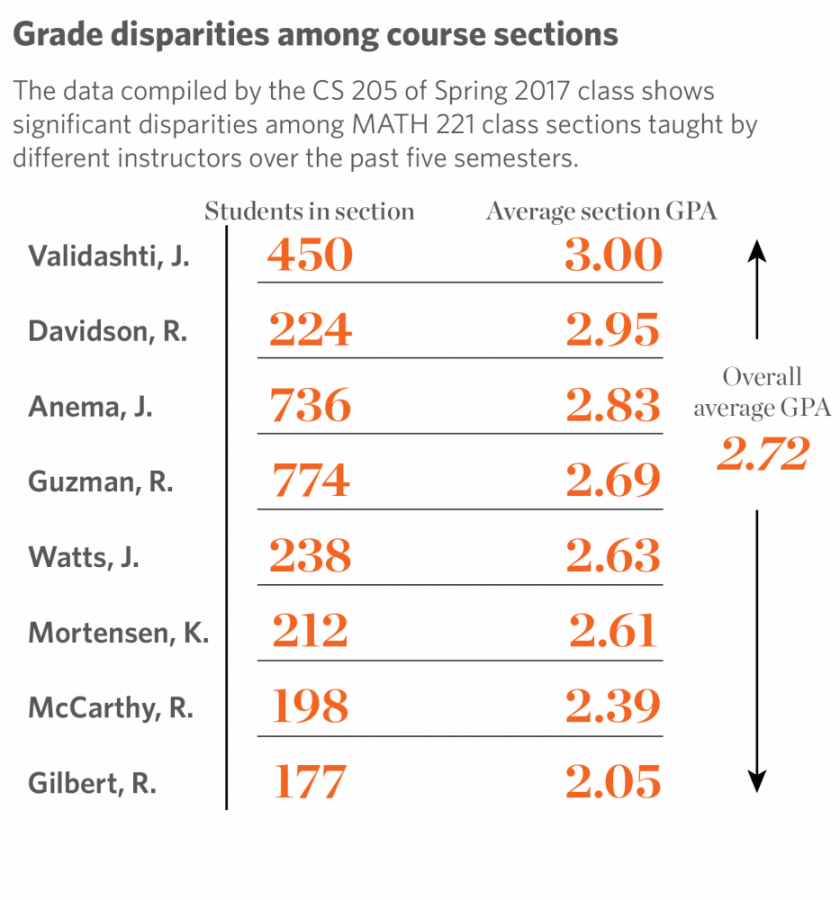
Data shows grade disparities between University multi-section courses
Source: CS 205
Oct 16, 2017
Grade disparities across the University were revealed online from data compiled and published by teaching assistant professor Wade Fagen-Ulmschneider and students from his spring 2017 computer science class.
The data reveals grade disparities between many University multi-section courses during all semesters, including winter and summer, from fall 2014 through fall 2016.
Fagen and his computer science class, CS 205: Data Driven Discovery, acquired GPA data that was used to “find out whether the perception of disparity of grades between different sections is true or not.”
An example of such disparities given by Fagen and his students are MATH 221: Calculus I grades amongst the eight different instructors’ sections for the course from fall 2014 through fall 2016; the highest average GPA for a MATH 221 section was a 3.00, while the lowest was a 2.05.
Fagen and his students noted that they found that the time of day of the lecture, and if the course was in-person or online, were major contributors to the final grades in a course.
Get The Daily Illini in your inbox!
Interim Director of Rhetoric Kristi McDuffie supervises, trains and evaluates instructors for multi-section rhetoric courses.
McDuffie said in an email that significant grade disparities don’t seem to be an issue for rhetoric courses at the University.
“I could pull some information to be sure,” she said. “But in my experience, there actually isn’t wide disparity between grades that students earn in rhetoric classes.”
McDuffie said that all rhetoric courses’ instructors attend a week-long pre-semester orientation when they begin teaching rhetoric and are trained in writing pedagogy and evaluating student writing. Instructors then continue training through professional development events that are offered at least monthly.
McDuffie said that for graduate student TAs, who typically have less teaching experience, participate in oriented seminars and peer mentor groups.
Though the training programs offer recommendations for the grade percentages for essays, homework and other assignments, McDuffie said grade disparities can still occur amongst sections due to the discretion given to instructors.
“Rhetoric program instruction is driven by program goals and best practices in teaching writing,” she said. “Beyond that, individual instructors write their own syllabi, assignment prompts and lesson plans. The course is thus so contextualized that some grade variation is normal from section to section.”
With regard to any given multi-section course at the University, McDuffie said that when comparing grades across sections, certain factors need to be taken into account.
“Is there a common syllabus for the course? A common textbook?” she said.
McDuffie said it’s important to take into account the student learning outcomes for the specific course, program, department and individual. It’s also important to consider how assessments, such as exams and essays, are written and administered.
University administration plays no part in grade disparity issues among the school’s courses, said Associate Provost for Academic Effectiveness Staci Provezis, and the issue is handled within colleges and departments.
Colleges such as LAS leave departments responsible for “creating and maintaining their own curricula, which includes determining what is taught and under what guidelines,” said Kelly Ritter, associate dean for curricula and academic policy.
Violet Kamber, junior in Engineering, said she came across the CS 205 data on the UIUC subreddit while studying abroad in Madrid last spring. She said she was impacted by seeing the section grade distributions for MATH 221.
“Right away I thought, ‘Wow, that makes a lot of sense now,’ because there are so many different sections and professors for Calculus (I), and I feel like with other classes it’s the same way,” she said. “The data helped me to visualize (the section disparities).”
Kamber said she even used the data to decide on her fall schedule.
“I actually used the data for an ECE course; I looked up TA’s (section GPA averages),” she said. “I kind of got an idea just looking through the grade disparity data just how different (grades in) courses can be. It’s surprising.”
Regarding data on grade disparities between course sections, Kamber said she hopes that such data is available for students in the future.
“I just hope that someone continues to do this and compiling this data,” she said.


