School data finds that public school racial disparities persist
April 8, 2014
Black students in Champaign-Urbana are more likely than white students to be disciplined and are less likely to enroll in higher-level courses, according to public school data from the Department of Education Office of Civil Rights 2011 Data Collection report.
These self-reported numbers fall in line with the report’s overall national data, which show that black students make up 18 percent of the report’s sample, yet receive 39 percent of total discipline, while their white peers make up 51 percent of the report’s sample and receive 34 percent of total discipline.
Additionally, the report shows nearly half all students enrolled in local early childhood education programs are black. In both Urbana School District 116 and Champaign Unit 4 schools, these programs function as an alternative to private pre-schools for at-risk children who may come from low-income families.
A correlation between race and income exists in Champaign-Urbana, as in most American communities, said Mark Aber, an associate professor of psychology who has prepared racial climate studies on Unit 4.
“These are not new problems. We’re dealing with the contemporary manifestation of pretty old problems,” he said.
Get The Daily Illini in your inbox!
Discipline
Although black students are disproportionately more likely to be disciplined than their white peers in Unit 4 and District 116, Unit 4 Superintendent Judy Wiegand said disciplinary action is taken only when students display certain behaviors that require it.
“Why is it that certain minorities display that type of behavior on a more frequent basis than other groups?” Wiegand said. “Is it because they may be disenfranchised with the public school system? Is it because they don’t feel they can be successful within the school? I think there is a variety of reasons students act out within the schools.”
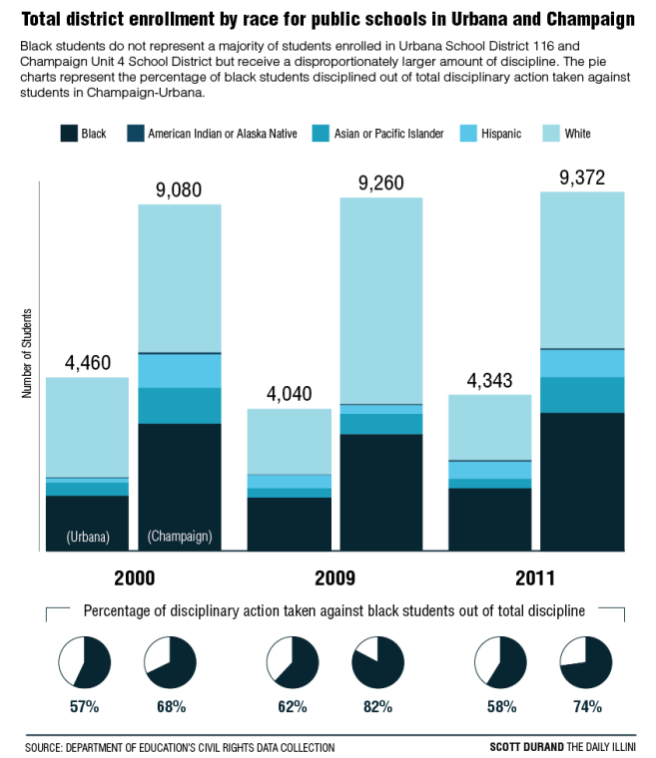
In Champaign’s 2011 report, black students make up 73 percent of all students disciplined while comprising 34.8 percent of the district’s 9,372 enrolled students. The 2011 disciplinary rate represents a decrease from a peak of 82.7 percent reported in 2006, which followed a reported 68.1 percent black students disciplined in 2000.
In contrast, white students made up 13.8 percent of students disciplined in 2011 while making up 40.7 percent of district enrollment. This rate has been up and down for the past four reports on file, with a high of 28.7 percent in 2000 and a low of 14.5 percent in 2006.
To address these disparities, Wiegand said Unit 4 has been trying to make more holistic approaches by looking at what is causing that behavior in the first place via the ACTIONS program — “Alternative Center for Targeted Instruction and ONgoing Support.” Rather than giving a student an out-of-school suspension, the student is sent to another building where the issues that may have led to the suspension are dealt with.
Similarly, Urbana School District 116 Superintendent Don Owen said the district has been seeking new approaches to address the racial disparities in discipline. When working with discipline, he said any plans need to be long-term solutions, rather than quick fixes.
On the high school level, Owen said the administration has shared the disciplinary data with students, which has been very powerful. The students prepared a research study on the discipline data in which they interviewed and surveyed students, teachers and administrators, focusing on the most common offenses that were getting students suspended.
“The high school administration actually used that data to incorporate into their school improvement plans when it came to addressing issues of racial disparity in the area of student discipline,” Owen said.
In District 116, black students made up 58.8 percent of total students disciplined, seeing a net gain of 1.7 percentage points since 2000. In 2009, the rate had risen to 62 percent before falling to 58.8 percent in 2011. In 2011, black students made up 36.9 percent of District 116’s 4,343-student enrollment.
Comparatively, in 2011, white students made up 23.3 percent of all students disciplined in District 116. This rate has continued to decrease since 2000, when the rate was 38.8 percent. White students made up 38.8 percent of students enrolled in 2011.
“All of these things take a lot of time and a lot of concerted effort (to fix), and we’re never satisfied when we see a lot of these disparities,” Owen said.
Early childhood education
Both Unit 4 and District 116 offer early childhood education services to children as young as 3 years old through the Illinois Preschool for All Program, which allows schools to provide early childhood education to students who are deemed to be at risk of academic failure because of home and community environment, among other disadvantages. Students also qualify if their family income is less than four times the federal poverty level.
Black students make up the majority of those enrolled in both Unit 4 and Urbana’s early childhood education programs.
Both Owen and Wiegand said these programs serve as an alternative to private preschool programs for students who would not otherwise have access to early childhood programs.
“The design of our preschool program is to prepare this group of students to be successful at the elementary school level,” Owen said. “It’s really designed to be kind of a seamless introduction into kindergarten for students that maybe wouldn’t necessarily have a formal schooling situation without this program in the community.”
Advanced middle school programs
Despite the higher representation in early childhood education programs, the data collection report shows that black students tend to be disproportionately underrepresented in Champaign’s gifted and talented education program and Urbana’s seventh and eighth grade Algebra I enrollment, both offered in middle school as a means to prepare students for high school courses. This is something that both districts have been trying to address for a number of years.
In Urbana, algebra enrollment by eighth grade has been increasing over the years, but Owen said he is not fully satisfied with the higher numbers alone.
“I do want our eighth grade algebra to look like our representation of the total demographics of the school,” he said.
As of 2011, that is not yet a reality for District 116. Black students make up 10.9 percent of those enrolled in Algebra I by seventh or eighth grade, decreasing from 21.1 percent in 2009, while white students make up the majority, at 63 percent, remaining steady from 2009.
However, it should be noted that Hispanic students made up 4.3 percent of those enrolled in middle school Algebra I in 2011, previously not represented in 2009, although the sample size decreased from 95 students to 92.
In Unit 4, Wiegand said that even though black students are underrepresented in Unit 4’s data, “The gap is beginning to close.”
On the whole, Unit 4’s 2011 gifted and talented enrollment data seems to be relatively racially equitable, although minorities aside from Asian students remain somewhat underrepresented.
In 2009, black students were best represented in gifted and talented enrollment compared to the 300 students reported to be enrolled in middle school Algebra I; however, in 2011, no students were reported to be enrolled in middle school Algebra I, and Unit 4’s gifted and talented enrollment numbers had increased from 1,250 to 1,738.
Nationally, white students made up the majority — 57 percent — of those enrolled in middle school Algebra I. Hispanic students made up 21 percent, and black students made up 11 percent. These results seem to mirror the reports of Unit 4 and District 116, although both districts have lower Hispanic district enrollment than the national sample, and Unit 4 appears to better represent black students. Additionally, both districts have larger percentages of black students enrolled overall, and in algebra courses, than the national Algebra I sample size and algebra enrollment percentage.
In these districts and other racially similar districts, this under-representation in advanced programs holds true, Aber said.
“I think it reflects primarily the fact that our schools are not as well designed to meet the needs and interests of African-American youth as they are to meet the needs and interests of white children,” he said. “You could also say that our schools aren’t well designed to meet the needs and interests of low-income kids as they are to meet the needs and interests of kids from middle and upper-income families.”
Higher-level courses and Advanced Placement
In Unit 4 and District 116, black students are overrepresented in chemistry enrollment numbers. In both districts, chemistry is a required class for graduation.
Wiegand said chemistry acts as more of an entry-level science class in Unit 4, while in District 116, Owen said chemistry is likely a class students would end with.
In both districts, black students are underrepresented in calculus and physics courses. Wiegand said these are junior and senior courses in Unit 4, and sometimes students just don’t take them.
“If you’re going on to a four-year college or university, physics or calculus are courses that you’ll need,” she said.
For 116, Owen said the district does offer other options for math courses that are not represented by the Office of Civil Rights reports, adding that physics is more an elective than chemistry.
While black and Hispanic students are underrepresented in physics and calculus enrollment, white and Asian students are overrepresented in both of these courses in both districts and, in District 116, underrepresented in chemistry enrollment.
Both districts will subsidize the cost of Advanced Placement tests for low-income students — Champaign will cover whatever cost is needed and Urbana will provide scholarships to help students with the costs. Still, the majority of students taking at least one AP course in each district are shown to be white. Among those few minorities who enrolled in an AP course and chose to take the exam, the data shows that no black students passed any of their AP exams in either district. Aber said complex social dynamics are involved in these low passage rates.
“Because African-Americans are vastly underrepresented in those contexts, they don’t feel particularly safe in them,” he said.
He noted that African-American students often report that the teachers and students in those classrooms don’t understand what their lives are like, what they care about, and, sometimes, those teachers and students devalue or do not understand the language or actions of black students.
“They often feel like they are viewed as not as smart and not as capable in those courses,” Aber said. “I think that contributes to them not being quite as successful as you’d hope they would be.”
He added that black students probably take their AP exams with less preparation, perhaps in part because there is motivation on the district’s part to try to increase minority enrollment in those higher-level classes, and it’s hard to make that shift mid-stream in the course of a student going through school. Aber noted that the students best prepared for AP courses are those identified very early and taught how to perform in those kinds of rigorous courses.
“I think it’s connected to the failure to engage effort in American kids in gifted and talented programs at the elementary school level and at the honors programs in the middle school, which help set the kids up to succeed in the AP courses at high school,” Aber said.
Curriculum adaptation
In terms of curriculum changes to adapt public schools to meet the needs of black youth, Aber said he believes there is value in trying to connect what is taught in the curriculum to lived experiences, as well as a focus on project-based learning.
He said there has been good national demonstration that project-based learning, which gives students the opportunity to work on concrete projects related to real issues and concerns in their communities, is a way to bring to life the value of traditional curricula concerns.
Additionally, Aber added that curricula could be better connected to the historical experience of African-Americans in the U.S. and prior to it, showing how the history of African people plays into the history of the United States and the implications of how our society is structured and what social relations across race look like today. When school boards and teacher staffs are not representative of the community, they do not do as good of a job in representing the interests of certain groups as they do in representing the interests of others, Aber said.
“African-American students and families are underrepresented in terms of their needs and views in various decision-making places, and that makes its way into policy and practice,” Aber said. “It changes how we make decisions.”
He said when parents or students don’t have the power or freedom to advocate or sit in on committees or other meetings, their interests naturally don’t compete as well against other interests being expressed and advocated for.
“Democracy works for those who are able and willing to participate.”
Tyler can be reached at [email protected] and @TylerAllynDavis.


